The weekly Market Reports are published after the close of business every Friday and are made available on the website to current subscribers. The reports are a composite of quantitative analytical tools that collectively aid in rapid identification and assessment of multiple market strategies. Each report is updated daily after the close of US markets at 5pm EST, for the next day. The Daily Reports are entirely quantitative and offer numerous illustrative analytical models that provide multiple statistical perspectives regarding historical price and volatility and risk-reward metrics pertaining to each market strategy.
Strategy specific outputs reflect the quantitative metrics associated with each strategy’s historical behavioral characteristics and include:- trade time horizon, probability distribution, historical average return, historical maximum return, historical average loss, historical maximum loss, maximum drawdown and mathematical expectation.
There are several proprietary tools in the module that further aid in strategy selection and timing. The Trend Heat Map identifies the trend direction for price, spread and volatility strategies across daily, weekly and monthly time frames. It can also be used to rapidly identify the weakest and strongest contracts in the term structure to further refine contract selection for relative value strategies. To assist in the timing of strategy entry and exit the Trend Change Indicator identifies changes in trend for each strategy across daily, weekly and monthly time frames. Historical probabilities identifies historical probabilities for individual strategies over the next 5 trading days based on their historical performance over the past 10 years. Strategies are collectively ranked according to their historical risk-adjusted return and the Top 10 are listed for each strategy group. These tools are available for all strategies and are updated daily. They can be readily applicable to both systematic and discretionary approaches.
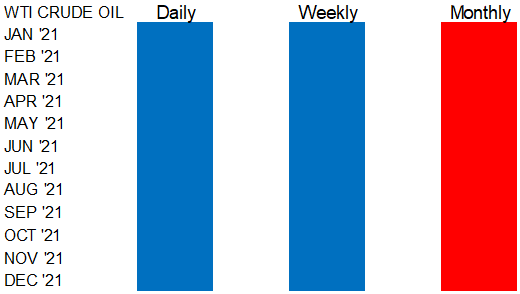
This indicator illustrates the current trend relating to a specific strategy for daily, weekly and monthly time horizons. It permits rapid assessment of prevailing trends for a particular strategy but can also be used for comparative analysis across the term structure. The example below illustrates the prevailing daily, weekly and monthly trends on November 27th 2020 for the January 2021-December 2021 inclusive WTI Crude Oil futures contracts.
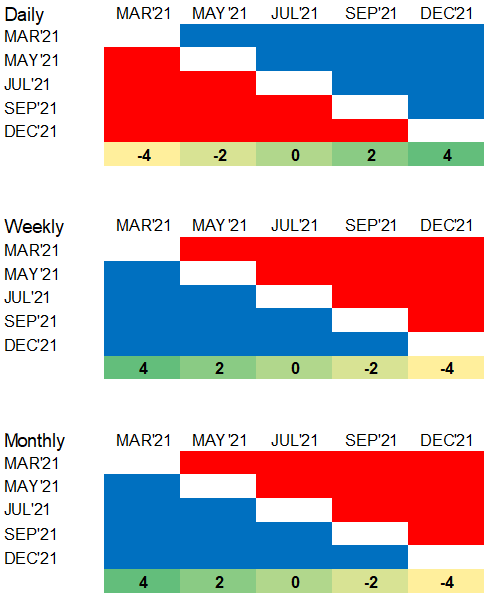
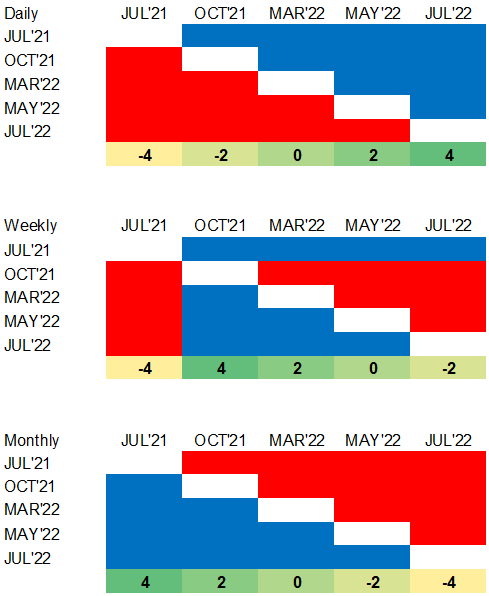
For spread strategies, the trend map reflects both the prevailing trend of the spread (blue and red bars) and the weakest and strongest months (yellow and green bars) in the term structure over different time horizons and can assist in identifying and structuring strategies along the term structure curve. The example below illustrates the prevailing daily, weekly and monthly trends in the Corn calendar spread term structure for March 2021 spreads as of November 27th2020.
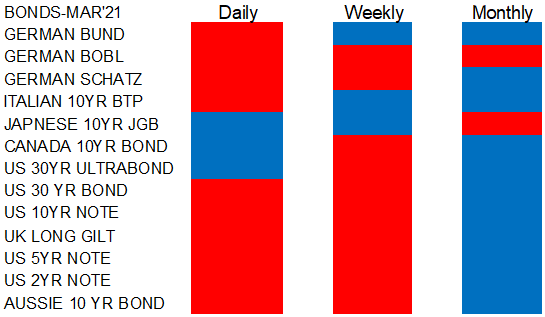
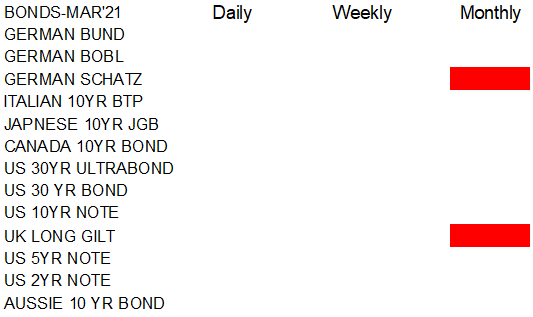
The Trend Change map uses momentum indicators to identify changes in trend for flat price, spread and volatility strategies across daily, weekly and monthly timeframes. Daily changes in trend are confirmed at the daily close, weekly trend changes are confirmed at the close of weekly trading and monthly trend changes are confirmed on the monthly close. The example below shows the prevailing change in monthly trend for the March 2021 Bond futures contracts as of Friday November 27th 2020. It illustrates an impending negative change in monthly price trend for German Schatz and UK Long Gilt futures prices that may be confirmed by the monthly close on the following Monday.
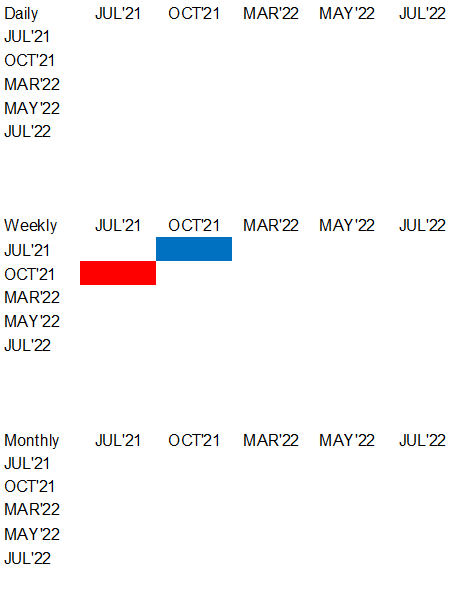
The example below illustrates the prevailing trends in the July 2021 calendar spreads for No.11 Sugar futures and the pending change in weekly trend for the July 2021-October 2021 calendar spread based on closing prices on Thursday November 26th 2020.
10-year historical probability statistics are available for all flat price, spread and volatility strategies and aid in rapidly identifying potential high conviction strategies based on the past 10 years of probability distributions associated with each strategy. The graphic below succinctly illustrates upcoming probabilities for the June 2021 Money Market futures contracts for the week beginning November 30th 2020. The historical probabilities associated with long and short positions for each strategy are shown for the next 5 trading days. Probabilities of 100% are highlighted in blue for buy strategies and red for sell strategies.
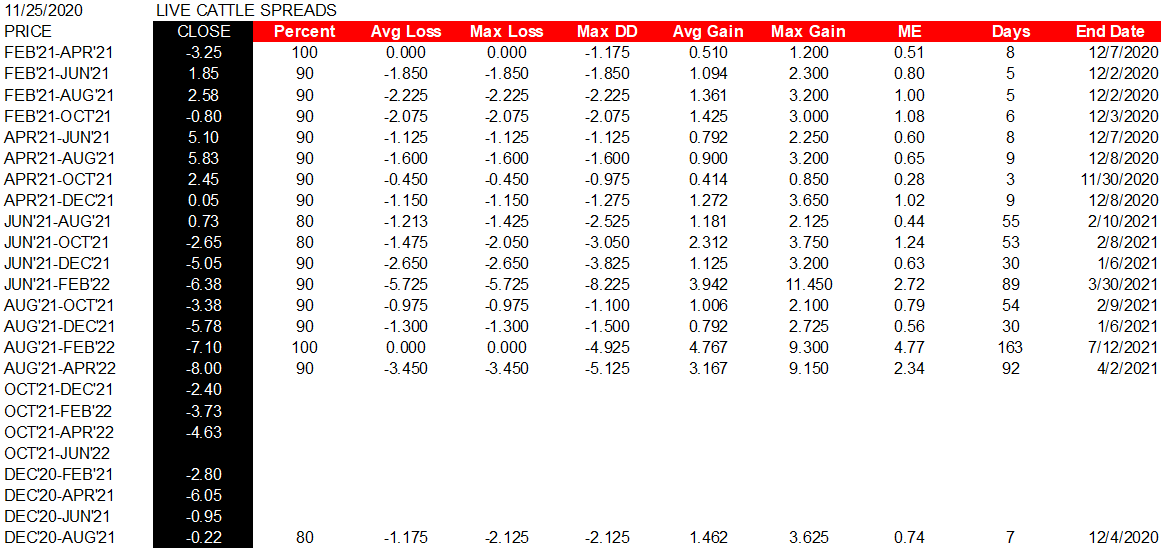
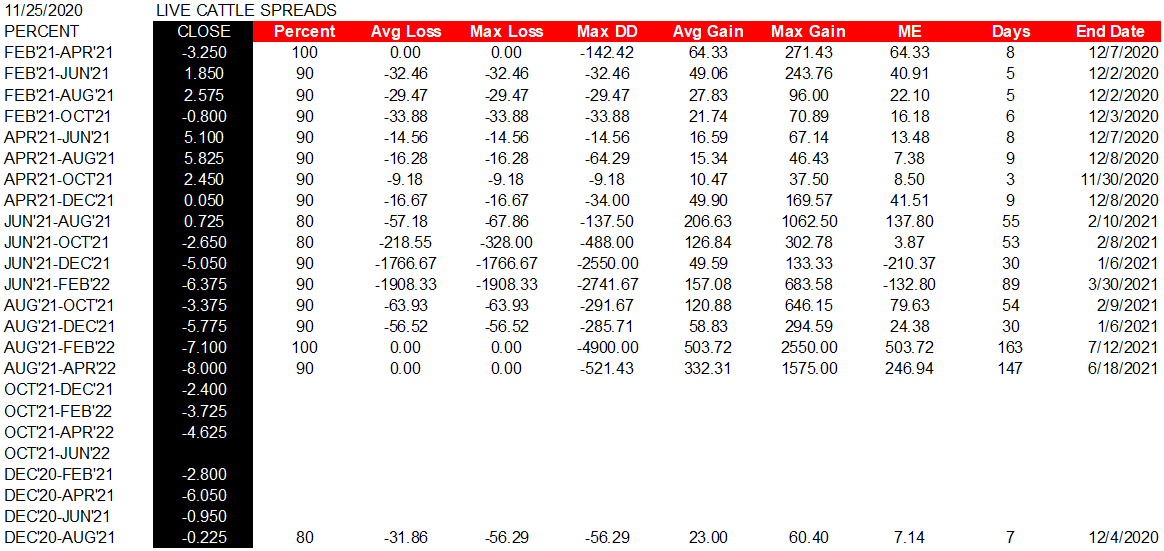
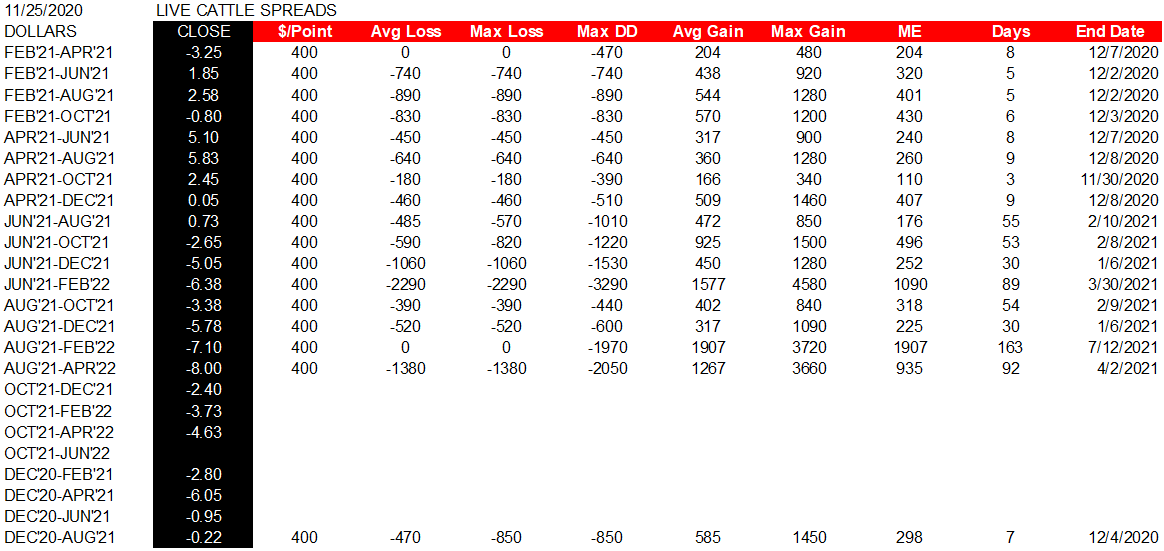
The 10-year historical risk-return profiles are updated daily after the close of trading and serve as quantitative dashboards that help assess potential strategies based on their respective risk-return metrics The tables listed are set to the past 10 years of historical data for each strategy and are available for flat price, spread and volatility strategies. Entry and exit dates are based on the closing price for the dates listed and are used to calculate profit and loss values. The example below illustrates 10-year historical risk-return statistics associated with the short December 2020-June 2022 Live Cattle calendar spread futures strategies as of November 25th 2020.
The data is presented in price, percent and dollar terms and gives the subscriber a deeper perspective than when just considering price data in isolation and not only enhance risk management but also give critical insight for portfolio structuring considerations.
As can be determined from the table below, short-dated Live Cattle spreads have a tendency to decline into the first week of December, with the February-August and February-October spreads exhibiting superior risk-adjusted returns over that time period. Additional color can be gained from the percent and dollar tables.
Entry Date’ is stated on the date stamp at the top left of the table. All strategy metrics are calculated using settlement prices.
The first column lists the individual strategies using their exchange listed symbols wherever possible. For clarification a list of these symbols and their long-form descriptions are available in the List of Markets link at the bottom of the Homepage.
The second column indicates the settlement price for that particular strategy using that day’s settlement price.
The red bar at the top with white text indicates that the strategy is a short strategy. Long strategies are depicted in blue.
The ‘Percent’ column details the win rate in percentage terms over the past 10 years for the specific strategy during its holding period (entry on November 26th 2020, exit on the ‘End Date’).
The ‘Average Loss’ column gives the historical Average Loss for the strategy over the past 10 years from the Entry date to the ‘End Date’.
The ‘Maximum Loss’ column details the historical maximum loss incurred for the strategy during the holding period over the past 10 years.
The ‘Maximum Drawdown’ column states the historical maximum loss from peak to low equity over the past 10 years during the holding period.
The ‘Average Gain’ column gives the historical Average Gain over the past 10 years for the strategy from the Entry Date to the ‘End Date’
The ‘Maximum Gain’ column details the historical maximum gain over the past 10 years for the strategy during the holding period.
‘ME’ is a conservative risk-adjusted return ratio calculated using Maximum Drawdown versus Average Loss. It is calculated as E(X)=E(X+)-E(X-), where Expected Value = Probability of Gain x (Average Gain) – Probability of Loss x (Maximum Drawdown).Strategies with Expected Values greater than 0 are preferred over those strategies with negative values.
‘Days’ is the total number of days (calendar days, not including weekends) in the strategy holding period.
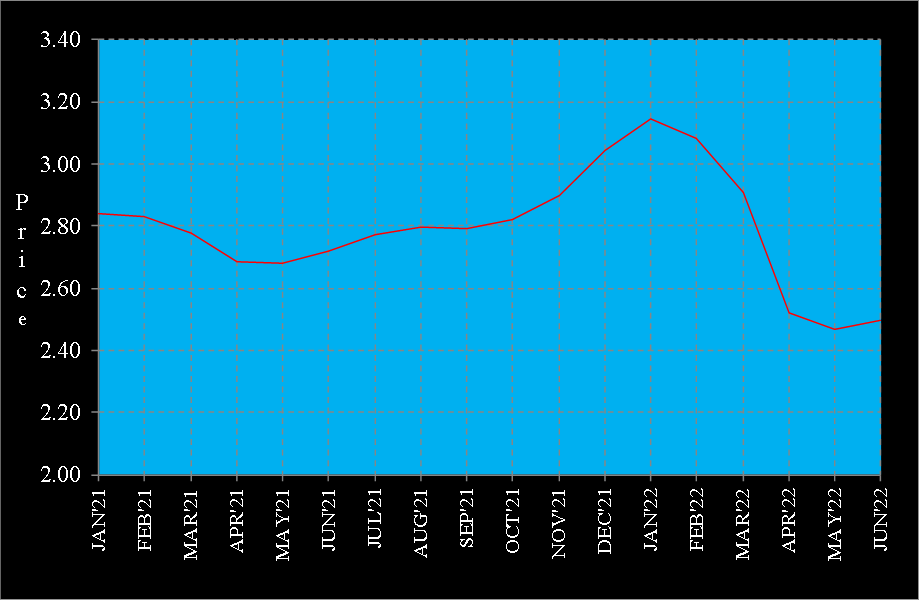
Commodity calendar spread strategies are provided with term structure charts that are updated daily and illustrate forward curve pricing showing the degree of prevailing contango and backwardation that exists. It is also useful in identifying opportunistic strategies driven by temporary aberrations in the curve shape due to temporary supply and demand shocks typically caused by weather and geo-political factors. The term structure illustrated below is the forward curve for Henry Hub Natural Gas futures extending to the June 2022 contract as of the close of trading on November 27th 2020.

To view available Subscriptions, please click here here